- Science
Nobeyama Radioheliograph Reveals Global Activity of the Sun
Outline
A research team consisting mainly of researchers from NASA and the Nobeyama Solar Radio Observatory have tracked the global activity of the sun over the past 20 years, covering not only sunspot activity, but also the sun's entire activity including activity in the solar polar region, using radio wave images from the Nobeyama Radioheliograph and solar magnetic field images from the Kitt Peak National Observatory in the USA and other groups. As a result, it was revealed that the sun's entire activity over the past 20 years has gradually been declining. Furthermore, this data shows that at the present time, the northern hemisphere has reached the solar maximum; on the other hand, the southern hemisphere hasn't yet reached it. In other words, solar activity synchronization has collapsed in both the northern and southern hemispheres.
The significant decrease in solar activity and the highly different situations in the solar activity level between the northern hemisphere and the southern hemisphere are shown for the first time since artificial satellites and solar-only, large observation equipment on the ground have been assembled. These research results, which are drawn from the high-quality and homogenous data obtained by the long-term, stable operation of the Nobeyama Radioheliograph, have raised doubts about our understanding of past solar activity. These are issues for solar physics, as well as for the long-term impact on interplanetary space and the upper atmosphere of the earth, which are dependent on solar activity.
Details
Number of Sunspots and the Solar Activity Cycle
The sunspot number is often used as the indicator of solar activity at relatively low latitudes, or 30 degrees or less. The sunspot number repeatedly increases or decreases over a nearly 11-year cycle, and the configuration of the polarity (north pole and south pole) of the sunspot magnetic field reverses every cycle. The cycles are numbered and the current cycle is in the active phase of solar cycle 24. In the solar minimum of solar cycle 23, the period when sunspots were not seen at all on the sun’s surface continued for a long time. Moreover, it is known that solar cycle 23 continued approximately two years longer than usual. Recent solar activity shows a different situation than ever seen before.
Solar Activity at High Latitudes
Solar activity at high latitudes also shows an 11-year cycle. However, at high latitudes, the greatest number of sunspots is at the solar minimum; in other words, that period is equivalent to the solar maximum at low latitudes. As the polar region is near the edge of the sun, observational equipment with a high spatial resolution is necessary to observe solar activity. Although it is known that the polarity of the magnetic field reverses at the solar minimum, the magnetic field becomes quite weak at the time of reversal, magnetic field observation in the polar region, which is difficult even under normal circumstances, becomes even harder to conduct. For that reason, observations near the high altitude regions have become possible only recently thanks to the "Hinode" satellite's high precision observation equipment.
Radio Wave Observation
Meanwhile, it became obvious through observations in the micro-wave band that the polar region appears bright, and that brightness shows the level of polar activity level. The radioheliograph (*), which is established on the Nobeyama Plateau at the foot of the Yatsugatake Mountains, has taken images of the sun's entire surface at the frequency of 17 GHz for 20 years, since 1992. The brightness distribution of radio waves over 20 years are arranged in the chart (below). At low latitudes, strong radio waves from active areas, including sunspots, are observed, as well as the phenomenon where radio waves move in the direction of the equator along with the progression of solar activity can be seen. This is called a (radio wave) butterfly diagram due to its shape.
This chart has the characteristic of being extremely bright in the polar regions. In addition, the bright period corresponds to the dark period at low latitudes, the solar minimum. Compared with the magnetic field distribution map (above)of the same period, when the polar magnetic field was strong, the radio waves also became strong, and their correlation is also good quantitatively. Based on the radio wave butterfly diagram and magnetic field distribution map, it can be seen that the activity of the sun's entire surface from solar cycles 22 to 24 has declined gradually in both the polar regions and low latitudes over the past 20 years. Additionally, they show that, as of March 2012, the brightness in the north polar region has reached the solar minimum, corresponding to the solar maximum at low latitudes. Therefore, the solar activity in the north polar region has kept an 11-year cycle. However, there have been no such signs in the southern hemisphere.
This situation where the cycle of the solar activity in the northern and southern hemispheres have been out of alignment is the first experience since artificial satellites and solar-only, large observation equipment on the ground have been assembled. The results of this research have raised doubts about our understanding of past solar activity. These findings will become matters for solar physics, as well as for the long-term impact on interplanetary space and the upper atmosphere of the earth, which are dependent on solar activity.
These research findings have been published in “The Astrophysical Journal,” an American astrophysics professional journal.
(*) “Nobeyama Radioheliograph” is a radio interferometer exclusively for solar radio wave observation operated by the Nobeyama Solar Radio Observatory of the National Astronomical Observatory of Japan (NAOJ). Composed of 84 parabolic antennas with an 80 cm caliber, this radioheliograph has taken images of the sun's entire surface at the frequency of 17 GHz for 20 years, since 1992.
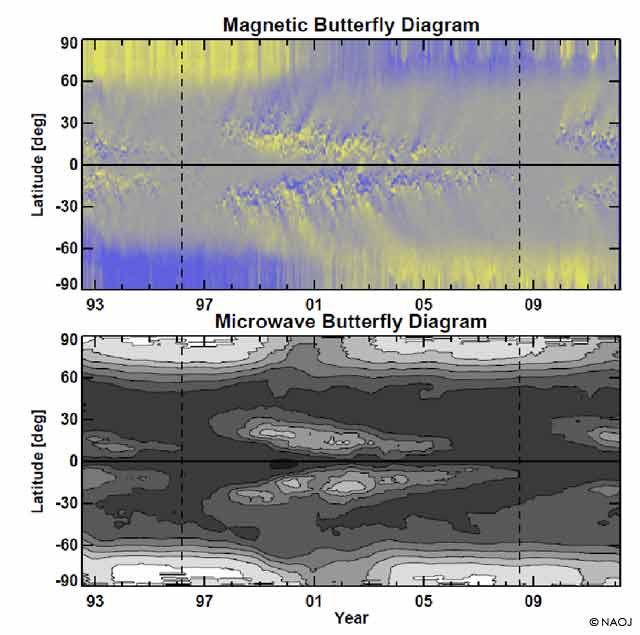
The intensity distribution time variation of the solar magnetic field (top chart) and radio waves (bottom chart). The low latitude zones (zone from between 30°north to 30°south latitudes. Almost all sunspots emerge in this area) indicate sunspot activity. The high latitude zones (zones from around 60°to 90°north latitudes, and from 60°to 90°south latitudes) indicate polar activity. They reveal that the strong magnetic field and radio waves observed at low latitudes move in the direction of the equator along with the progression of solar activity. These charts are called butterfly diagrams due to their shapes.
The top chart shows the fluctuation of the solar magnetic field over 20 years compiled from data from the Kitt Peak National Observatory in the USA and other sources (magnetic field butterfly diagram). In this chart, the vertical axis is the sun's surface latitudes, the horizontal axis is the year, the north pole is in yellow and the south pole is in blue.
The bottom chart is the fluctuation of the radio wave' strength over 20 years combined with radio wave images from Nobeyama Radioheliograph (radio wave butterfly diagram). The coordinate axes are the same as in the chart above (magnetic field butterfly diagram). The strength of the radio wave was indicated using contrasting shading and contours. Both the north and south polar regions appear bright, which shows a good correlation with the strength of the magnetic field in the chart above (magnetic field butterfly diagram).
In both charts, the dotted line shows when the sunspot activity is minimum in the low latitude zone. When activity is sluggish in the low latitude zone, activity becomes brisk in the high latitude zone. When comparing the brightness of the low latitude zone activity at its minimum in 1996, indicated by the dotted line, and those of the high-latitude zone in 2008, it can be seen that it was darker in 2008 than in 1996.
Research Paper Source
“Behavior of Solar Cycles 23 and 24 Revealed by Microwave Observations” by N. Gopalswamy et al., Astrophysical Journal Letters (in press), arXiv:1204.2816