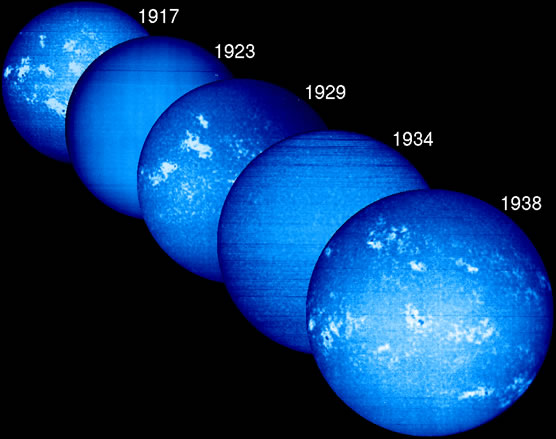
Solar Images from Taisho Period - Approximately 60 Years of Digitized Calcium K-line Solar Images Publicly Shown
| Topics
The Solar Observatory, National Astronomical Observatory of Japan (NAOJ) has digitized calcium K-line solar images on photographic plates/films, which had been observed between 1917 and 1974. Since long-term fluctuations in solar activity have become a topic of debate, and in order for many people to be able to utilize the approximately 60 years of accumulated data, we decided to publish the data on the website.
There is an absorption line (393.3nm), called “calcium K-line,” in the purple wavelength range of the solar spectra. It is known that solar images in this wavelength clearly indicate solar magnetic activity and the amount of ultraviolet radiation reaching the earth.
The Tokyo Astronomical Observatory, one of the predecessors of NAOJ took solar images in calcium K-line from 1917 to 1974, using an instrument called a “spectroheliograph.” Observation began at the observatory located in Azabu Ward (present Minato Ward, Tokyo) in 1917. After the Great Kanto Earthquake, the observatory was relocated to Mitaka Village (present Mitaka City, Tokyo), and observation was continued. A total of 8,500 days of observation data, which are recorded on photographic plates/films, has been accumulated.
The Solar Observatory has opened the digitized data to the public so that many people can utilize this valuable, long-term data. In addition to our data, there is also calcium image data recorded since the early 20th century in India and the United States. Through this combination of data, it is possible to know detailed solar activity for the past 100 years. Sunspot observation with it 400-year history and other findings indicate that there are long-term fluctuations in solar activity. It has not been long since modern observation of solar magnetic fields started, so it is very significant to be able to know solar magnetic activity over the past 100 years through the calcium images when studying how the fluctuations affect the earth.


Solar Activity Database
- Calcium K-line Full-Disk Spectroheliograms -